Research Article 
 Creative Commons, CC-BY
The Alteration of Gut Microbiota Between Patients with Left Ventricular Ejection Fraction Preserved and Reduced Heart Failure
*Corresponding author:Hongxiang Zhang, Department of Cardiology, the Second Affiliated Hospital of Wannan Medical College and Vascular Diseases Research Center of Wannan Medical College, China.
Received:April 17, 2023; Published:May 05, 2023
DOI: 10.34297/AJBSR.2023.18.002511
Abstract
Aims: In this study, 16S rRNA sequencing was used to reveal the changes of the composition and the metabolic pathways of intestinal flora in patients with Heart Failure (HF). Methods and results: Twenty patients with HF and five healthy adults were included. Patients were divided into group O (healthy adults), group P (LVEF ≥50%,), and group M (LVEF < 50%). Stool samples were collected on admission. High-throughput sequencing combined with bioinformatics analysis was used to detect the diversity of 16S rRNA gene V4 region of bacteria in the three groups. OTU dilution curves of all samples showed a gentle trend, indicating that the sequencing depth was appropriate. Compared with healthy adults, the composition of intestinal microflora in patients with HF was significantly different, mainly showing increased abundance of microbacili, Lactobacillus, Lactobacillus, Staphylococci and Staphylococci. The abundance of Roseburia, Megamonas and Catenibacterium increased in the HF group with LVEF ≥50% compared with LVEF < 50%. Decreases occurred in Clostridiales, Veillonella, Sutterella, and Bilophila. Preliminary functional analysis of the flora showed that genes involved in Trimethylamine-n-Oxide (TMAO) synthesis, lip-polysaccharide synthesis, and lipid metabolism pathways were significantly increased in the HF group with LVEF ≥50% compared with the healthy adult group. At the same time, there was no significant difference between LVEF ≥50% and <50% group. Compared with healthy adults, the predicted phenotypes in the HF group were mainly an increase in gram-positive bacteria, a decrease in aerobic bacteria and in gram-negative bacteria. Conclusions: Compared with healthy adults, the gut microbiota of patients with HF is significantly unbalanced. The functional changes of intestinal flora in HF were preliminarily elucidated by bioinformatics functional metabolic analysis.
Keywords: Heart failure, Gut Microbiota, 16S rRNA, Sequencing, Left ventricular ejection fraction
Introduction
Heart Failure (HF) is the terminal stage of the development of various cardiovascular diseases, and it results in high morbidity and mortality [1]. Previous studies have suggested important impacts of inflammation and immune dysfunction on the pathogenesis of heart failure [2,3]. The intestinal tract harbors are the largest bacterial community within the human body [4]. There are 300-500 different strains of bacteria colonized in each human intestinal tract [5]. Therefore, the gut microbiota is known as the second genome of the body [6]. The intestinal flora and host have a mutually beneficial relationship and are interdependent [7]. The gut is one of the main reservoirs of T cells in the body, which are in close contact with gut bacteria to maintain homeostatic control of local and systemic immunity.
Currently, about 80% of gut microbes could not be cultured yet [8]. In view of this, direct evidence for gut microbiota dysbiosis in heart failure patients was still lacking. There were individual animal experimental and clinical studies unveiled dysbiosis of gut microbiota in heart failure bodies [9,10]. However, the relationship between intestinal microbiota dysbiosis and severity of heart failure has not been reported in the literature. In the present study, 20 hospitalized patients including 10 patients with reduced (left ventricular ejection fraction < 50%) and 10 patients with preserved (left ventricular ejection fraction ≥50%) left ventricular ejection fraction (LVEF) heart failure, as well as 5 healthy adults are randomly selected, and faecal samples are collected from each group, these samples are then subjected to 16S sequencing analyses, to provide direct evidence and comprehensive understanding of gut microbiota dysbiosis in heart failure.
Methods
Study Cohort
A total of 20 patients with heart failure were enrolled and divided into group P (LVEF ≥50%, BNP≥100ng/L) and group M (LVEF < 50%, BNP≥100ng/L). In addition, Group O included 5 healthy adults, including 2 males and 3 females, aged 56-70 years old, who enrolled from the Physical Examination Center during the same period. There were 4 male patients and 6 female patients in group P, ranging in age from 50 to 88 years old. Group M included 7 male patients and 3 female patients, aged 52-87 years.
Inclusion and Exclusion Criteria
Inclusion criteria were diagnosis of heart failure with LVEF <50% or ≥50%, including dyspnea at rest or during mild activity, BNP≥100ng/L, and complete medical records. Exclusion criteria included chronic renal insufficiency, inflammatory bowel disease, and treatment with antibiotics or probiotics.
Sample Collection
Aseptic sampling spoon is used to select the stool specimen formed in the morning, which is about the size of soybeans, and placed in the sterile stool collection box. It is well recorded and immediately sent to the laboratory for storage in the -80℃ refrigerator.
DNA Extraction
Total bacterial genomic DNA samples were extracted using the metagenomic DNA was extracted from all samples using the PowerMax (stool/soil) DNA isolation kit (MoBio Laboratories, Carlsbad, CA, USA), following the manufacturer’s instructions, and stored at −20°C prior to further analysis. The quantity and quality of extracted DNAs were measured using a NanoDrop ND- 1000 spectrophotometer (Thermo Fisher Scientific, Waltham, MA, USA) and agarose gel electrophoresis, respectively. 16S rDNA Amplicon Pyrosequencing PCR amplification of the bacterial 16S rRNA genes V4 region was performed using the forward primer 515F (5’-GTGCCAGCMGCCGCGGTAA -3’) and the reverse primer 806R (5’- GGACTACHVGGGTWTCTAAT-3’). Sample-specific pairedend 6-bp barcodes were incorporated into the TrueSeq adaptors for multiplex sequencing. The PCR components contained 25 μl of Phusion High-Fidelity PCR Master Mix, 3 μl (10 uM) of each Forward and Reverse primer, 10 μl of DNA Template, 3μl of DMSO, and 6 μl of dd H2O. Thermal cycling consisted of initial denaturation at 98 °C for 30 s, followed by 25 cycles consisting of denaturation at 98 °C for 15 s, annealing at 58 °C for 15 s, and extension at 72 °C for 15 s, with a final extension of 1 min at 72 °C. PCR amplicons were purifi ed with Agincourt AMPure XP Beads (Beckman Coulter, Indianapolis, IN) and quantified using the Pico Green dsDNA Assay Kit (Invitrogen, Carlsbad, CA, USA). After the individual quantification step, amplicons were pooled in equal amounts, and pair-end 2×150 bp sequencing was performed using the Illumine NovaSeq6000 platform at GUHE Info technology Co., Ltd (Hangzhou, China).
Sequence Analysis
The Quantitative Insights into Microbial Ecology (QIIME, v1.9.0) pipeline was employed to process the sequencing data, as previously described. Briefly, raw sequencing reads with exact matches to the barcodes were assigned to respective samples and identified as valid sequences. The low-quality sequences were filtered through following criteria: sequences that had a length of <150 bp, sequences that had average Phred scores of <20, sequences that contained ambiguous bases, and sequences that contained mononucleotide repeats of >8 bp. Paired-end reads were assembled using V search V2.4.4, Operational Taxonomic Unit (OTU) picking using V search V2.4.4,included Dereplication, cluster, detection of chimeras.
A representative sequence was selected from each OTU using default parameters. OTU taxonomic classification was conducted by V SEARCH searching the representative sequences set against the green gene database. An OTU table was further generated to record the abundance of each OTU in each sample and the taxonomy of these OTUs. OTUs containing less than 0.001% of total sequences across all samples were discarded. To minimize the difference of sequencing depth across samples, an averaged, rounded rarefied OTU table was generated by averaging 100 evenly resampled OTU subsets under the 90% of the minimum sequencing depth for further analysis.
Statistical Analysis
Continuous variables which conformed to the normal distribution were expressed as mean ± standard deviation. Categorical data are summarized as frequencies and percentages. The student’s t-test was employed for comparisons of the normal distribution continuous variables. Additionally, comparisons of two independent samples of ordinal or non-normal distribution continuous variables were conducted using the Mann-Whitney U test. A two-sided p value < 0.05 was considered statistically significant. Statistical analyses were performed with SPSS Version 20.
Results
Clinical Characteristics of Subjects
In this study, heart failure patients were divided into Group P (LVEF ≥50% and BNP≥100ng/L) and Group M (LVEF < 50% and BNP≥100ng/L). The clinical data of the samples were shown in Table 1. Among them, there were 10 patients in P group, aged 73.00±14.52 years old. There were 10 patients in group M, aged 68.70±12.73 years. There were 5 patients in group O, aged 62.00±5.52 years. There was no significant difference in gender and age among all groups, and no statistical difference in hypertension, atrial fibrillation and dyslipidemia between group P and group M.
Sequencing results of fecal specimens and Operational Taxonomic Units (OTU) analysis
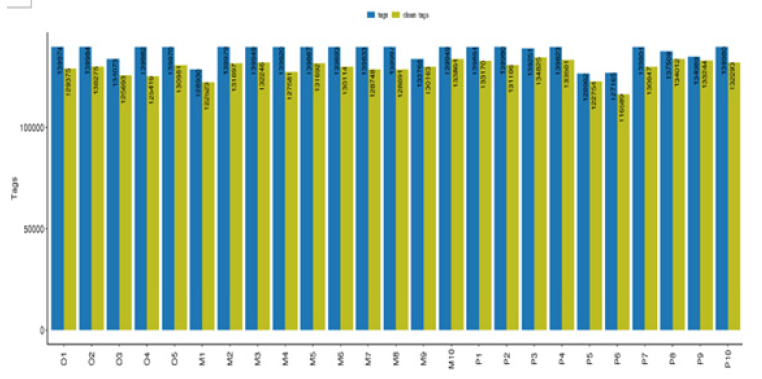
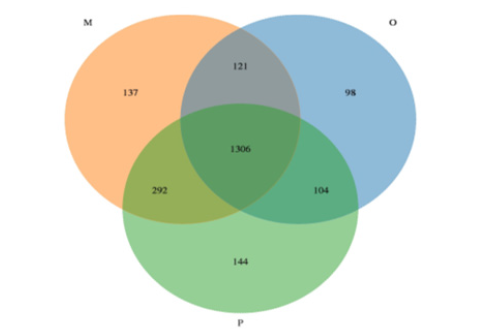
Sequence data: The sequencing platform of this study used Illumina Novaseq sequencing platform to conduct double-terminal sequencing on the samples. We obtained 16S rRNA sequence data, then matched and assemble, quality control and filter, removed chimeras, and finally obtained effective sequences. The statistical results of the length of sequences contained in all samples were shown in Figure 1. A total of 3240,603 high-quality sequences were obtained from 25 samples in this study, with an average of 129,624 sequences per sample. According to the OTU clustering results, a Venn diagram was drawn with OTU clustering at the similarity level of 97% (Figure 2), and the number of unique and common OTU among different samples in each group was compared. In this study, there were 2202 kinds of OTUs in all samples, and 1306 kinds of OTUs were common among the three groups. There were 98 kinds of OTUs peculiar to group O, 144 kinds of OTUs peculiar to group P, and 137 kinds of OTUs peculiar to group M.
Alpha Diversity Analysis
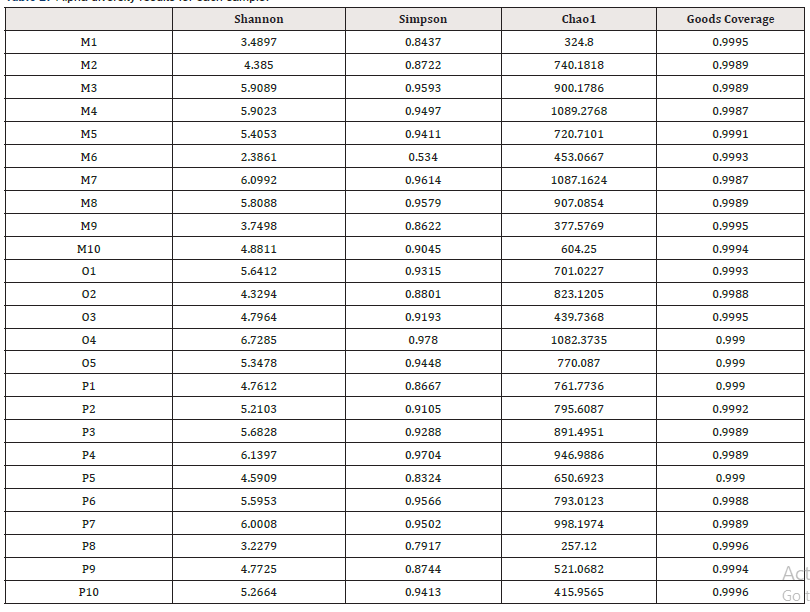
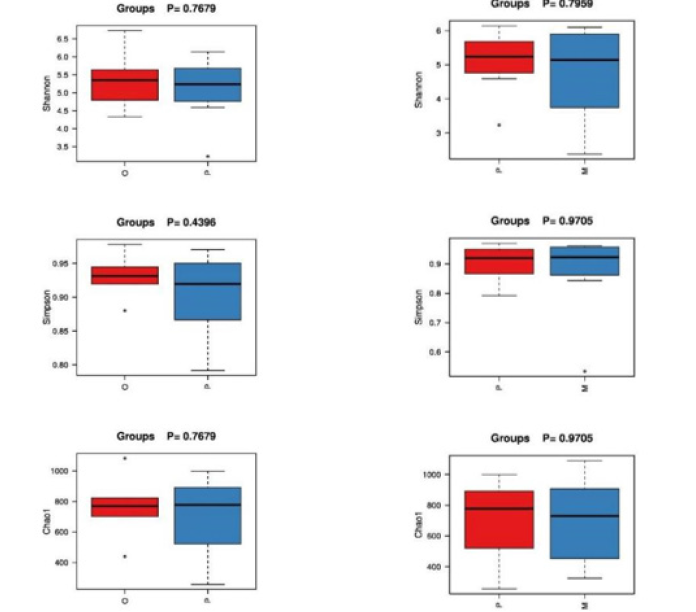
In community ecology, Alpha diversity is an analysis using statistical indices to assess the species richness and diversity of each group of flora. Among them, richness is used to measure the number of species in a single sample, which can be evaluated by the number of taxonomic units. In addition, diversity index is used to measure the heterogeneity of a community. The larger Chao1 index is, the greater the total abundance of species is. Shannon index is used to indicate species diversity, while Simpson index is used to evaluate bacterial community diversity. The diversity index statistics of each sample are shown in Table 2. Good’s Coverage data of each group of samples were all above 0.95, indicating that the sequencing coverage was high, and the results were closer to the real intestinal ecology. The wilcox.test function in R was used to compare the differences of indexes between groups (Figure 3): In terms of intestinal flora diversity, group O > group P > group M; The richness index of intestinal flora in group P > group M > Group O. Although there were differences among all index groups, pairwise comparisons among the three groups showed no statistical significance (P > 0.05).
OTU Rarefaction Curve
The diluting curve is to use OTUs of all the measured sequences to randomly extract random number sequences and count the extracted sequences each time to calculate the expected value of Alpha diversity index. Then, the curve is made according to the expected value of the calculated diversity index and the statistical table of Alpha diversity index is made. As can be seen from Figure 4, species richness in all samples is different, and the overall curve tends to be flat, indicating that the sequencing data amount is large enough and reasonable, which can reflect the information of the vast majority of microbial species.
Beta diversity analysis
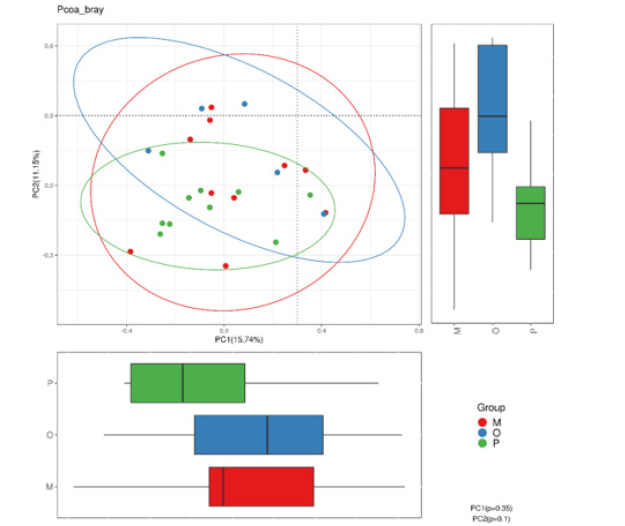
Principal coordinate analysis: Principal Coordinate Analysis (PCoA) is a visualization method to study data similarity or difference. In the first step, according to the species annotation results and sequence abundance information of all groups, the sequence information of the same classification was combined and classified, so as to obtain the species abundance information table. At the same time, the Unifrac distance is further calculated by using the phylogenetic relationship between OTUs. In the second step, the Weighted Unifrac distance is further constructed by using OTUs abundance information for Unifrac distance. Finally, the differences among different samples (groups) were found through multivariate statistical methods such as Principal Component Analysis (PCA) and PCoA. Principal component analysis results of the three groups of samples are shown in Figure 5. PC1 and PC2 contributed 15.74% and 11.15% respectively. The samples among the three groups were scattered in the figure, and no significant clustering was found.
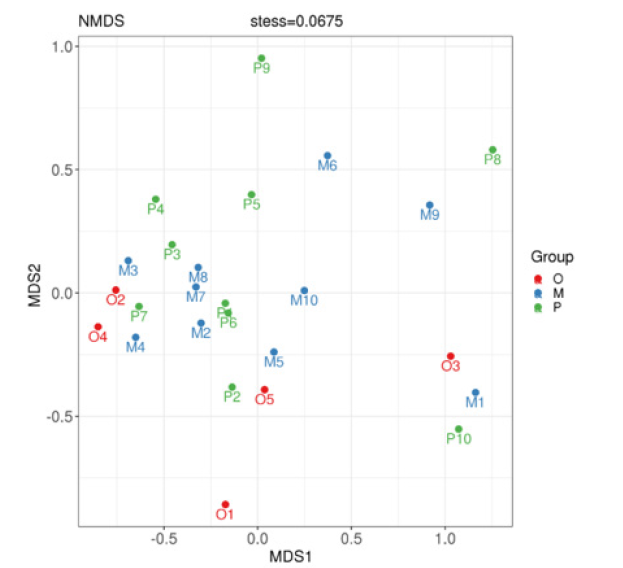
Nonmetric multidimensional scale analysis:Non-metric Multidimensional Scale (NMDS) analysis is an analytical method based on sample distance matrix to show specific sample distance distribution through dimensionality reduction. Different points in the graph represent different samples, the distance between sample points describes the strength of repeatability, and the distance between different groups of samples reflects the difference in rank of sample distance between groups. The calculation method of sample similarity distance has an influence on the result, and the results of matrix with different similarity distance values are different in different degrees. NMDS analysis showed that, as shown in Figure 6, there was a certain difference between the healthy adult group and the heart failure group, but there was no significant difference in the composition of the bacteria with different ejection fractions (stress=0.0675).
Analysis of Intestinal Microflora in Three Groups
Comparison of intestinal flora at phylum taxonomic level: Through the comparative analysis of database, it was found that Firmicutes and Bacteroidetes were the two phyla with the highest abundance of intestinal flora in all samples, 41.9% and 50.0% respectively in healthy adult group, 50.8% and 32.1% respectively in heart failure group with ejection fraction ≥50%. Ejection fraction < 50% was 48.5% and 41.4% in the heart failure group, respectively. Proteobacteria accounted for 5.6%, 11.9% and 7.4%, Fusobacteria 0.4%, 3.0% and 0.6%, and Actinobacteria 1.7%, 0.6% and 1.4%, respectively. Compared with the results of species annotation, the top 10 species were selected from all samples at the phylum classification level to draw the relative abundance histogram. Each bar chart represents a sample, and the taxa are distinguished by color. The longer the column, the higher the relative abundance of the taxa in the corresponding sample. The results are shown in Figure 7.
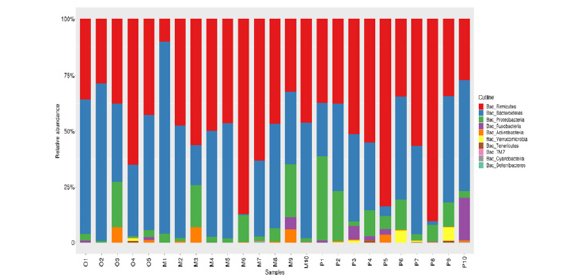
Figure 7:The composition of intestinal microflora in groups O, P and M at phylum classification level.
Comparison of intestinal flora at the level of genus classification: At the generic level, the increased abundance in the heart failure group with an ejection fraction ≥50% compared to the healthy adult group included: Parabacteroides (2.2%), Ruminococcus (1.6%), Megamonas (5.2%), Akkermansia (1.3%); The reduction is: Bifidobacterium (0.4%), Bacteroides (22.9%), Prevotella (3.1%), Lachnospira (1.1%), Phascolarctobacterium (1.1%), Veillonella (1.0%) and Sutterella (0.6%).
The abundance of Roseburia (5.0%), Megamonas (9.4%) and Catenibacterium (0.4%) increased in patients with chronic heart failure with ejection fraction ≥50% compared with patients with chronic heart failure with ejection fraction < 50%. Decreased Clostridiales (1.1%), Veillonella (1.0%), Sutterella (0.4%), and Bilophila (0.1%).
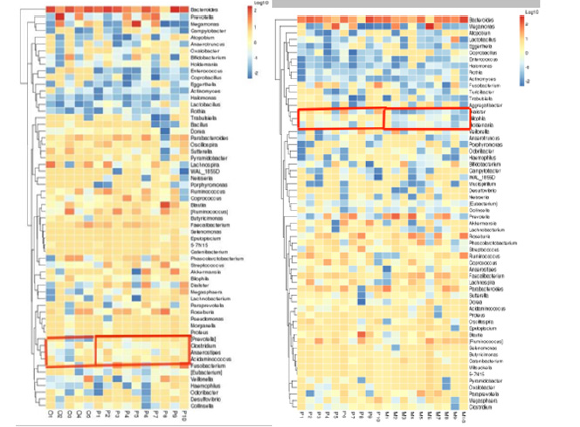
Clustering heat maps based on genus level: In this study, cluster analysis was conducted between healthy adult group and heart failure group with ejection fraction ≥50%, heart failure group with ejection fraction ≥50% and heart failure group with ejection fraction < 50%. From figure 9, we can understand the similarity between samples and the similarity of community composition at the genus level. Part of the box in Figure 8 shows that there are differences in abundance between the two groups.
LEfSe analysis between groups: LEfSe is based on Linear Discriminant Analysis (LDA), which combines Linear discriminant analysis with nonparametric Kruskal-Wallis and Wilcoxon rank sum test. Thus, species with significant differences in biomarkers between groups were screened. Use different colors to represent significant differences in species between groups. The definition threshold was set as 2, and the species difference was quantified by LED score. The statistical results are shown in Figure 9A and Figure 9B. It can be seen that the differences in genus level between healthy adult group and heart failure group with ejection fraction ≥50% are mainly in Dialister, Lactobacillaceae, Lactobacillus, Staphylococcus, Lactobacillus, Lactobacillus, Lactobacillus, and Staphylococcus. Staphylococcaceae. Compared with the group with LVEF < 50%, LVEF ≥50% group had the advantage in Dialister, Coriobacteriales and Synergistia, while the latter group had the increase of YS2 and S24-7 families.
Functional Alteration of Gut Microbiota in Heart Failure Patients
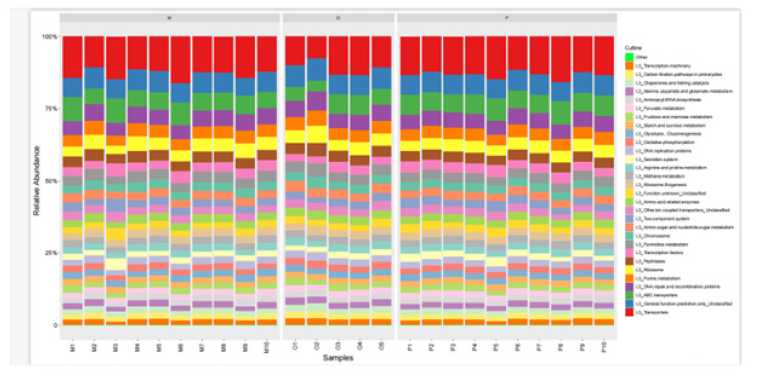
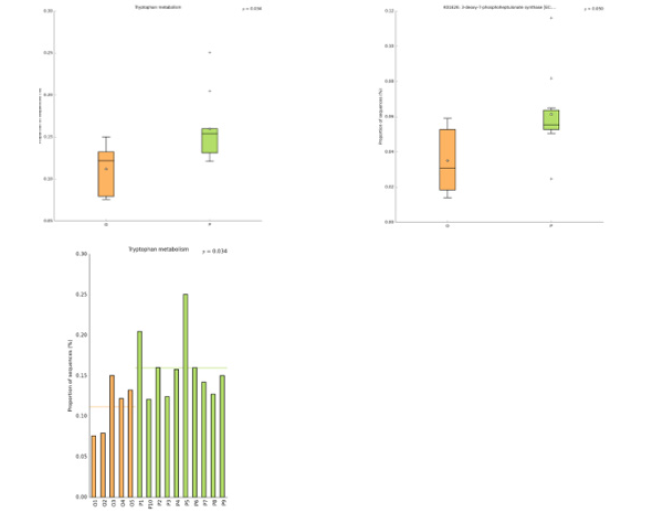
In this study, the intestinal flora genomes of each subgroup were compared in KEGG database, and the functional characteristics of each subgroup were preliminarily defined. Figure10 shows the top 30 metabolic pathways with the highest abundance of all samples. Compared with normal adults, genes involved in Trimethylaminen- Oxide (TMAO) synthesis, lipopolysaccharide synthesis, and lipid metabolism pathways were significantly increased in the HF group with LVEF ≥50% (Figure11). And studies have shown that elevated TMAO concentrations are associated with an increased risk of death. Microbial genes for choline TMA-lyase, the key enzyme for the generation of TMAO which is a cardiac harmful metabolite, significantly upregulated in HF patients. At the same time, there was no significant difference between group P and group M (Figure12).
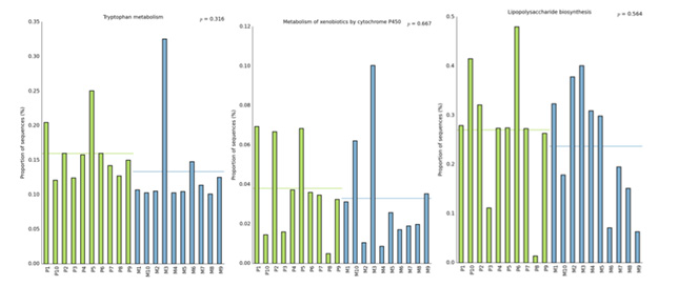
Figure 12:Comparison of the genomic function of intestinal flora in different ejection function groups.
Comparison of Phenotypic Classification Based on Bug Base
The Bug base tool focuses on phenotypic prediction, Phenotype includes Gram Positive, Gram Negative, Forms Biofilms, Pathogenic, Mobile components (Contains Mobile Elements), oxygen demand, including Anaerobic, Aerobic, Facultatively Anaerobic and Stress tolerance. As shown in Figure 13, compared with healthy adults, the predicted phenotypes in the HF group were mainly an increase in gram-positive bacteria, a decrease in aerobic bacteria, and a decrease in gram-negative bacteria.
Discussion
With the application and development of microbiology sequencing and genomics, more and more studies have revealed that intestinal flora is closely related to the process of a variety of diseases. In this study, the differences of intestinal flora between patients with heart failure and healthy adults, as well as the changes of intestinal flora with different heart functions, were explored mainly through 16S rRNA amplicon sequencing and biological analysis of sample feces. And found that the intestinal microbiota composition of patients with HF was significantly different from that of healthy adults, The main results showed that the abundance of Dialister, Lactobacillaceae, Lactobacillus, Staphylococcus and Staphylococcaceae were increased. However, after the deterioration of heart function, the abundance of YS2 and S24-7 in the intestinal tract increased, while the abundance of Microbacillus decreased.
In humans, choline is metabolized by microbes in the gut into trimethylamine, which is rapidly absorbed in the liver and converted to atherogenic TMAO [11]. It was found that TMA extracted from choline significantly affected the level of TMAO and its physiological effects [12]. The process of conversion of trimethylamine to TMAO mainly depends on the CUTC gene of intestinal flora to encode lyase to convert choline to TMA [12]. Among the intestinal flora, Enterobacteria had the greatest effect on the trimethylamine lyase [13]. At the same time, some studies found that another part of Cut-DD genes affecting lyase mainly came from three families: Bacteroidaceae, Lachnospiraceae and Ruminococcaceae [14]. In this study, it was found that the abundance of rumen coccaceae in the intestinal flora of patients with heart failure increased from 8.8% to 14.3% and 15.2% compared with the healthy adult group. The abundance of Enterobacteriaceae increased from 3.1% to 6.6% and 10.7%.It can be inferred that TMAO levels were elevated in the heart failure group.
The large number of intestinal flora in healthy people not only participate in the metabolism of the body, but also resist the colonization of pathogenic microorganisms, and regulate the intestinal tract and the immune system of the body [14]. In this study, through functional analysis of differences between groups, compared with the healthy group, the main characteristic of the left ventricular ejection fraction preserved HF was that the abundance of Microbacillus and Lactobacillus significantly increased, while the abundance of Microbacillus significantly decreased with the progression of HF. After comparing the healthy group with the HF group, it was found that the number of Bacteroides declined in the HF group, with 31.8% in the healthy group and 23.0% and 22.9% in the HF group, respectively. Another promoter of the involvement of intestinal flora in heart failure is the significant increase in various opportunistic pathogens leading to an imbalance of harmful and protective metabolism. This study found an increase in Bacillus faecalis and Streptococcus faecalis in the chronic heart failure group compared to the healthy adult group. Harmful metabolites produced by opportunistic pathogens are involved in activating myocardial inflammation [15] and reducing anti-inflammatory levels.
Compared with healthy adults, the number of rumen cocci community increased in HF group. In terms of the proportion of the abundance at the genus level, the community numbers of Ruminococcus in healthy adult group, LVEF ≥50% group and < 50% group were 8.8%, 14.3% and 15.2%, respectively. There was no statistically significant change in abundance (P > 0.05). Further, the analysis of significantly different species between groups showed that the intestinal flora composition of patients with HF was significantly different from that of healthy adults, with increased abundance of Microbacillus, Lactobacillaceae, Lactobacillaceae, Staphylococcus and Staphylococcus. However, after the LVEF was further reduced, the abundance of YS2 and S24-7 in the intestinal tract increased, while the abundance of Microbacillus decreased. Therefore, it can be inferred that there is an increase in the abundance of Ruminococcus in the intestine between the healthy adult group and the HF group, but there is no significant difference.
With the development of molecular biology technology in recent years, the understanding of intestinal rumen coccus has become more and more comprehensive. In a study on inflammatory bowel disease, rumen cocci were found to be the most abundant bacteria, which increased the level of intestinal inflammation [16]. In the study of allergic disease in infants, the prominent feature is the aggregation of rumen cocci in the intestine, leading to T cell dilation, eosinophils and mast cell infiltration [17]. In the human colon, as beneficial bacteria, it plays the role of degrading starch to provide energy [18] and produces secondary bile acids [19] to maintain intestinal homeostasis [20]. At present, due to the limited accuracy of sequencing methods, it is not possible to classify the species level. In addition, some studies have shown that the intestinal flora enriched in HF caused by different etiologies is also different. In conclusion, more accurate sequencing analysis methods are needed in the future to further clarify the relationship between the changes in the number of ruminococcus and the occurrence and development of HF.
Admittedly, this study has some limitations. First, although the standard of excretion is set to exclude most comorbidities affecting the structure of the intestinal flora, it ignores the effects of drugs for the treatment of HF and the different etiologies of HF. Second, due to various limitations, the sample size of the study is a little insufficient, and some of the results obtained are only correlation conclusions. In the future, large sample size experiments are needed to further study the causal relationship between heart failure and the occurrence and development of intestinal flora.
Conclusion
This study showed that compared with healthy adults, the intestinal flora of patients with HF was significantly unbalanced. At the same time, specific strains were obtained through the analysis of significant differences between groups, and the functional changes of intestinal flora in patients with HF were preliminarily expounded by bioinformatics functional metabolism analysis. It not only provides evidence for the existence of intestinal flora disorder in patients with HF, but also lays a foundation for the study of the interaction between the two.
Acknowledgments
This work was partly supported by National Natural Science. Foundation of China (Grant No 81800445) and supported by the Natural Science Fund of Wuhu science and Technology Bureau
Funding Information
National Natural Science Foundation of China, Grant/Award Number: 81800445.
Conflict of Interest
The authors have no conflicts of interest to disclose.
A Data Availability Statement
The data used to support the findings of this study are available from the corresponding author upon request.
References
- Fan M, Huang Y, Chen Z, Xia Y, Chen A, et al. (2019) Efficacy of mesenchymal stem cell therapy in systolic heart failure: a systematic review and meta-analysis. Stem Cell Res Ther 10(1): 150.
- Mann D L (2015) Innate immunity and the failing heart: the cytokine hypothesis revisited. Circ Res 116(7): 1254-1268.
- Fukunaga T, Soejima H, Irie A, Sugamura K, Oe Y, et al. (2007) Relation between CD4+ T-cell activation and severity of chronic heart failure secondary to ischemic or idiopathic dilated cardiomyopathy. Am J Cardiol 100(3): 483-488.
- Chiang HI, Li JR, Liu CC, Liu PY, Chen HH, et al. (2019) An Association of Gut Microbiota with Different Phenotypes in Chinese Patients with Rheumatoid Arthritis. J Clin Med 8(11): 1770
- You L, Zhu L, Li PZ, Wang G, Cai H, et al. (2020) Dysbacteriosis-Derived Lipopolysaccharide Causes Embryonic Osteopenia through Retinoic-Acid-Regulated DLX5 Expression. Int J Mol Sci 21(7): 2518
- Jiang S, Huo D, You Z, Peng Q, Ma C, et al. (2020) The distal intestinal microbiome of hybrids of Hainan black goats and Saanen goats. Plos One 15(1): e228496.
- Goto T (2020) Airway Microbiota as a Modulator of Lung Cancer. Int J Mol Sci 21(9): 3044
- Walke JB, Becker MH, Hughey MC, Swartwout MC, Jensen RV, et al. (2015) Most of the Dominant Members of Amphibian Skin Bacterial Communities Can Be Readily Appl Environ Microbiol 81(19): 6589-6600.
- Francisco J Carrillo Salinas , Marina Anastasiou, Njabulo Ngwenyama, Kuljeet Kaur, Albert Tai, et al. (2020) Gut dysbiosis induced by cardiac pressure overload enhances adverse cardiac remodeling in a T cell-dependent manner. Gut Microbes 12(1): 1-20.
- Xiao Cui, Lei Ye, Jing Li, Ling Jin, Wenjie Wang, et al. (2018) Metagenomic and metabolomic analyses unveil dysbiosis of gut microbiota in chronic heart failure patients. Scientific reports 8(1): 635
- Zeisel SH, Warrier M (2017) Trimethylamine N-Oxide, the Microbiome, and Heart and Kidney Disease. Annu Rev Nutr 37: 157-181.
- Levin BJ, Balskus EP (2018) Discovering radical-dependent enzymes in the human gut microbiota. Curr Opin Chem Biol 47: 86-93.
- Zuo K, Liu X, Wang P, Jiao J, Han C, et al. (2020) Metagenomic data-mining reveals enrichment of trimethylamine-N-oxide synthesis in gut microbiome in atrial fibrillation patients. Bmc Genomics 21: 526.
- Lazar V, Ditu LM, Pircalabioru GG, Gheorghe I, Curutiu C, et al. (2018) Aspects of Gut Microbiota and Immune System Interactions in Infectious Diseases, Immunopathology, and Cancer. Front Immunol 9: 1830.
- Intapad S (2019) Sphingosine-1-phosphate signaling in blood pressure regulation. Am J Physiol Renal Physiol 317(3): F638-F640.
- Hall AB, Yassour M, Sauk J, Garner A, Jiang X, et al. (2017) A novel Ruminococcus gnavus clade enriched in inflammatory bowel disease patients. Genome Med 9(1): 103.
- Chua HH, Chou HC, Tung YL, Chiang BL, Liao CC, et al. (2018) Intestinal Dysbiosis Featuring Abundance of Ruminococcus gnavus Associates With Allergic Diseases in Infants. Gastroenterology 154(1): 154-167.
- Crost EH, Le Gall G, Laverde Gomez JA, Mukhopadhya I, Flint HJ, et al. (2018) Mechanistic Insights Into the Cross-Feeding of Ruminococcus gnavus and Ruminococcus bromii on Host and Dietary Carbohydrates. Front Microbiol 9: 2558.
- Sinha SR, Haileselassie Y, Nguyen LP, Tropini C, Wang M, et al. (2020) Dysbiosis-Induced Secondary Bile Acid Deficiency Promotes Intestinal Inflammation. Cell Host Microbe 27(4): 659-670.
- Graziani F, Pujol A, Nicoletti C, Dou S, Maresca M, et al. (2016) Ruminococcus gnavus E1 modulates mucin expression and intestinal glycosylation. J Appl Microbiol 120(5): 1403-1417.






 We use cookies to ensure you get the best experience on our website.